

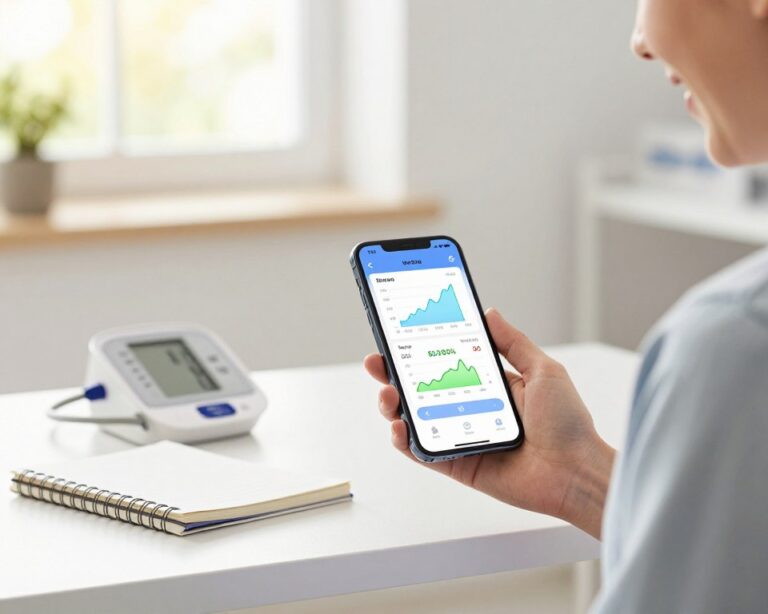
Having the right app is one thing. Using it in a way that actually improves your health outcomes is another.
Most people download a blood pressure app, log a few readings, and then open it once a month when they remember. That’s not the app’s fault it’s a habit problem. And habit problems have practical solutions.
This guide is about the behavioral side of blood pressure monitoring: how to set yourself up to measure consistently, what your data is actually telling you, and how to turn months of readings into something useful at your next appointment.
Why Consistency Is Everything
A single blood pressure reading is close to meaningless. Blood pressure fluctuates throughout the day typically lower in the morning before you get out of bed, rising through the morning, peaking in the afternoon, and dropping at night. It responds to stress, posture, caffeine, conversation, and dozens of other variables.
What gives readings clinical value is pattern. A month of readings taken under consistent conditions same time of day, same arm, same posture, thirty minutes after your last coffee reveals something a snapshot never can. It tells you what your blood pressure actually looks like under ordinary daily life, not just the conditions of a clinical setting.
This is why reminders matter. Not as nagging, but as anchors.
Setting Up Your Reminders Right
Every major blood pressure app includes notification reminders. Most people either skip this setup entirely or set a single daily reminder that becomes easy to ignore. Neither approach works well.
A more effective system uses two measurement windows:
Morning window (6–9 AM): Take your reading within an hour of waking, before coffee, before exercise, before the day has activated your stress response. This is your baseline. It reflects your overnight recovery and is often the most stable reading of the day.
Evening window (6–9 PM): A second reading in the evening, taken after you’ve been seated for at least five minutes, captures how your blood pressure behaves under daily load. Elevated evening readings that differ significantly from your morning baseline can point to stress, diet, or medication timing issues worth discussing with a physician.
In apps like Withings Health Mate or Planta (via custom reminder tools), you can set two separate recurring alerts. Label them clearly. Turn off “snooze” if the app allows it — snooze encourages indefinite postponement.
One practical tip: pair your measurement habit with an existing routine. Morning reading after brushing your teeth. Evening reading before dinner. The physical anchor — the cuff already sitting on your nightstand or kitchen counter — does as much work as the phone notification.
Reading Your Own Trend Data
After two to three weeks of consistent logging, your app’s trend view starts to become genuinely informative. Here’s how to read it without overinterpreting.
Look at the line, not the points. Individual readings spike and dip for all kinds of reasons. A single elevated reading after a stressful day is noise. A trend line that’s been creeping upward over three weeks is a signal.
Watch for time-of-day patterns. Most apps let you filter by time window. If your morning readings are consistently normal but your evening readings are elevated, that’s a specific, actionable pattern — one that might relate to sodium intake, alcohol, work stress, or medication timing.
Understand the categories. The American Heart Association classifies adult blood pressure as follows:
- Normal: Systolic below 120 AND diastolic below 80
- Elevated: Systolic 120–129, diastolic below 80
- Stage 1 Hypertension: Systolic 130–139 OR diastolic 80–89
- Stage 2 Hypertension: Systolic 140 or higher OR diastolic 90 or higher
- Hypertensive Crisis: Systolic above 180 AND/OR diastolic above 120 (seek care immediately)
Good apps display each reading color-coded against these thresholds. If the majority of your readings are landing in Stage 1 rather than Normal, that’s not an emergency — but it is something to bring to your doctor with data, not just a vague sense that things “seem high.”
Notice variability, not just averages. Someone whose readings range from 105/70 to 148/92 in the same week has a different profile than someone who consistently reads 130/85. High variability can itself be a clinical flag. Some apps calculate your average systolic and diastolic by week and month — use these to track whether a new habit or medication is moving the needle.
When Something Looks Wrong
Most home monitoring will produce entirely unremarkable data. But occasionally you’ll notice something that warrants attention.
If you record a reading above 180/120, the AHA considers this a hypertensive crisis. Retake the reading after five minutes of rest. If it remains at that level, seek medical care promptly — don’t wait for a scheduled appointment.
If you notice your readings are consistently 15–20 points higher on one arm versus the other, mention it to your doctor. Significant inter-arm differences can be a cardiovascular marker worth investigating.
If a new medication is causing your readings to drop significantly below your baseline — especially with dizziness or light-headedness — log the timing and bring that data to your physician. Medication dose adjustments often require exactly this kind of longitudinal data.
Preparing a Report for Your Doctor
This is the feature most users never bother with — and it’s one of the most practical.
Most good blood pressure apps offer a PDF export or printable report. Withings Health Mate generates a clean, professional-looking report that many physicians recognize and appreciate. Omron Connect exports a summary view that works similarly.
Before your next appointment, generate a 30-day or 90-day report. It should include:
- Average systolic and diastolic for the period
- Number of readings taken
- A chart showing the trend over time
- Any readings flagged as elevated or critical
Print it or save it to your phone’s photos so you can pull it up easily. Hand a printed copy to your doctor — or, increasingly, send it ahead via your clinic’s patient portal if that option exists.
What this does is shift the conversation. Instead of “How has your blood pressure been feeling lately?” — a question nobody can answer well — your doctor is looking at actual data. That leads to more specific questions, more targeted adjustments, and better outcomes.
One Habit, Compounded Over Time
Blood pressure monitoring isn’t a crisis intervention tool. Used well, it’s a long feedback loop — a way of understanding how your body responds to diet, exercise, stress, sleep, and medication over weeks and months.
People who monitor consistently tend to make better lifestyle decisions around it. They see that the week they walked thirty minutes daily, their morning readings dropped by eight points. They notice that their readings are higher after high-sodium meals. They have something concrete to point to when they need to make the case for a medication adjustment.
None of that happens from occasional measurements. It happens from the quiet, unglamorous discipline of checking every morning, logging every reading, and letting the data accumulate until it tells a story your doctor can actually use.
Set the reminders. Take the readings. Trust the trend.